Northern Ireland Index of Deprivation
Small Area N00000961 — Belmont_1, Belfast . Rankings are relative across Northern Ireland (1 = most deprived, 4,537 = least).
Decile colours: 1–3 higher deprivation · 4–7 mid · 8–10 lower deprivation.
Map
Overall position
NIMDM is an area-based, relative measure. It does not describe individuals.
Domain breakdown Small Area N00000961 — Belmont_1, Belfast
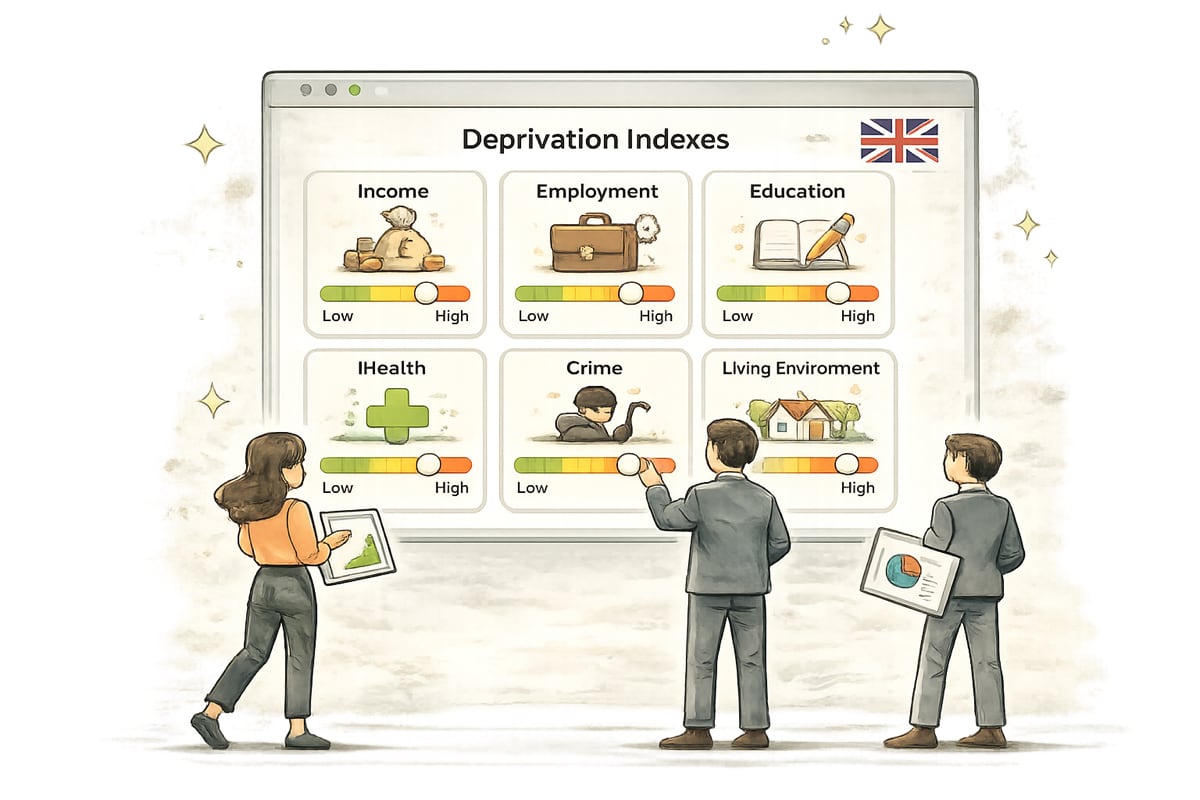
Low income, reliance on income-related benefits or tax credits.
Involuntary exclusion from the labour market.
Premature mortality, illness, mental health, disability.
Educational attainment and skills barriers.
Access to key services and infrastructure.
Quality of housing and the local environment.
Recorded crime and anti-social behaviour.
Note: NIMDM 2017 ranks are relative across Northern Ireland only.