English Index of Multiple Deprivation
LSOA21: E01015839 · Southend-on-Sea 014A
Note: Lower rank/decile = more deprived; higher rank/decile = less deprived. IMD 2025 (England). Next update not expected until 2031.
Decile colours: 1–3 higher deprivation · 4–7 mid · 8–10 lower deprivation.
Location Map
The shaded area on the map below shows the area that relates to the data for this area.
Domain Breakdown for Southend-on-Sea 014A
Overall score combining the individual domain scores.
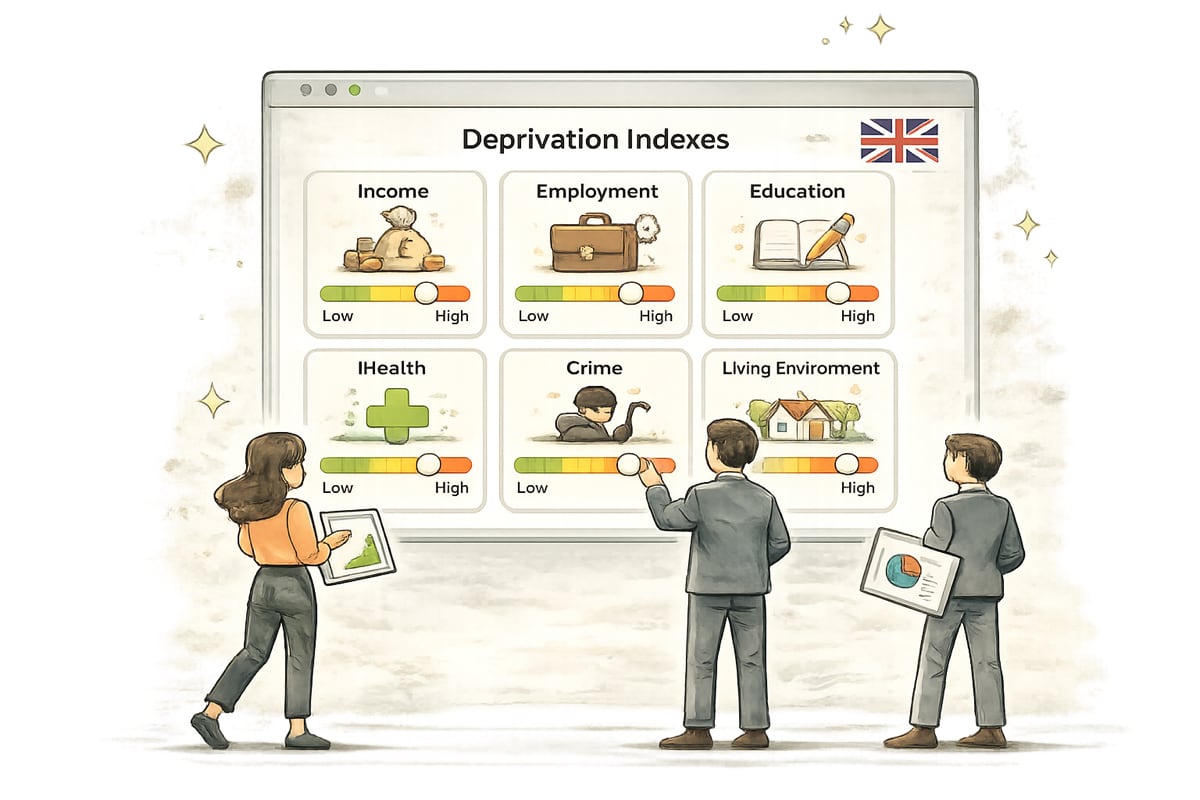
Measures deprivation due to low income, including people receiving income‑related benefits and tax credits.
Captures involuntary exclusion from the labour market, such as unemployment, long‑term sickness, disability, or caring responsibilities.
Reflects educational attainment and skills in children and adults, including school results, qualifications, and access to higher education.
Indicates risk of premature death and reduced quality of life due to illness, disability, or mental health conditions.
Measures risk of personal and material victimisation, including violence, burglary, theft, and criminal damage.
Assesses access to suitable housing and essential services, including affordability, overcrowding, and distance to key services.
Covers quality of the local environment, including housing condition, air quality, pollution, and road traffic incidents.