February 7, 2026
Moving Averages to Median, mostly!
The database change from MySQL to PostgreSQL makes more tools available. One of those is calculating the median in a far easier way ,which is one of the first changes I have made.

Swapping out MySQL for PostgreSQL allows me to do some things more easily. Averages are an annoyance in many ways; they don't lend themselves well to giving out the right signals, especially for a site like this. Median is the more appropriate and acceptable way to view some data.
The difference between Average and Median?
Averages and medians are different. To put it as simply as my head can;
Imagine you have 10 property sales. 9 of them sell for £250,000, and 1 sells for £5,000,000
- The Average - £725,000
- The Median - £250,000
A very clear difference between the two. Which is right? Well, both, depending on what you're looking for.
- With the average, you sum the total of all property sales values and divide by the number of sales. That's your £725,000
- With the median, you find the midpoint of all sales, that's £250,000
One is taking that outlier into account, the £5m sale, which pushes the average upwards. But the reality is that a £5m sale is noise when you're trying to understand the typical buyer. It's not reflective of what the market is paying from our dataset. 9/10 purchasers paid nowhere near £725,000 for a property. In fact, all 9/10 paid £250,000, so £725,000 cannot be reflective of the market. £250,000 is. So, we can say that the Median is the midpoint, ignoring any noise at the lower and upper ends of the market.
Example Chart
Take this chart, for example, which uses an average sale price across England/Wales. Using an average means higher-value sales are allowed to influence the result, which pulls the line around when very large transactions occur. For a broad market view that can be acceptable, but it does introduce distortion when the aim is to understand what most buyers are actually paying. The top 5% average is fine; it’s a much narrower dataset and will naturally look choppy. We want to see that movement there, it’s signal, not a distortion, because outliers are part of the story at that end of the market.
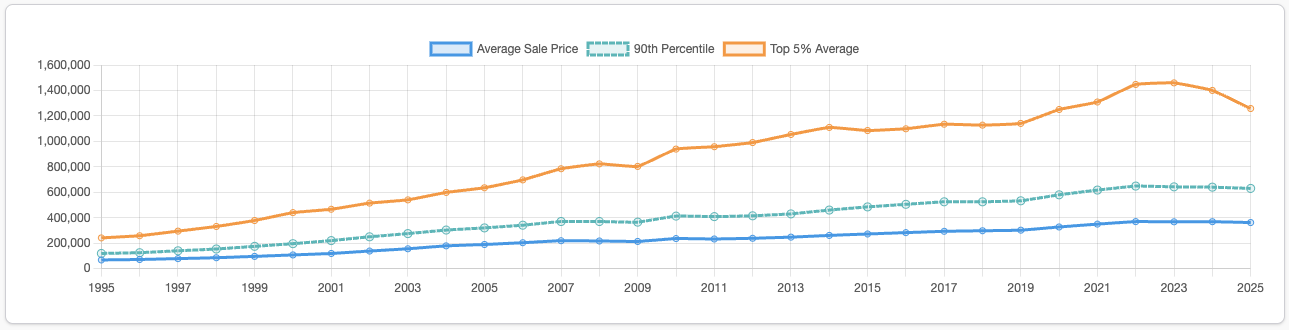
Now take a look at the chart, which uses a Median sale price instead of an average. It may not look that different. The Median sale price in 2025 is £294,750. However, the average sale price in 2025 is £361,783. That is a difference of £67,033, which is significant. And it's the distortion that the average takes into account in broad datasets that makes it so different.
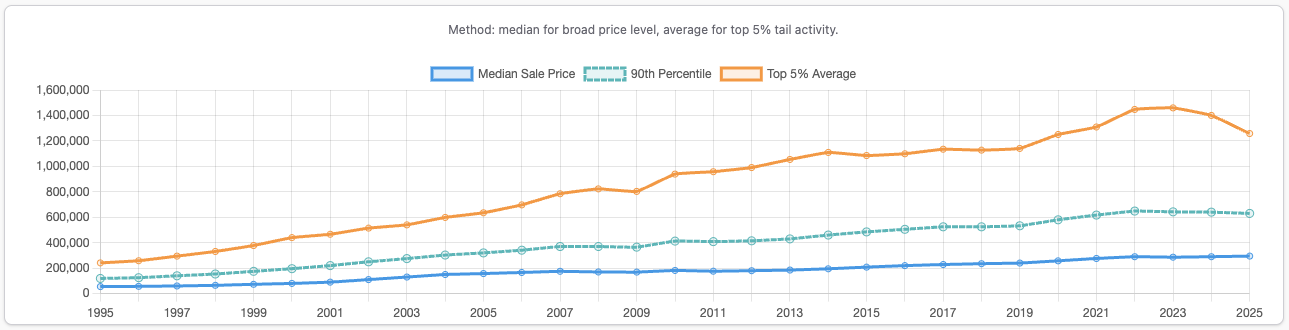
This is why Median is more important to signal market direction clearly and cleanly when looking at broader datasets.
Averages are still important, though
Median isn't always the right approach; I touched on this above. Outliers on broader datasets create noise you largely don't need. On much narrower datasets, those outliers are information rather than noise.
In Ultra Prime London, the number of sales is very low compared to the wider area of Greater London. So, using the median to smooth out the trend in sales, in fact, masks what is really happening. An area where sales at £20m or £60m are not necessarily common, but in smaller datasets are relevant, an average reveals that and adds to the story rather than detracting from it. So, you want to see that.
Bottom line
Any chart on this site that now uses Median used an average before today. So if the data looks different to your last visit, that will be the most likely reason.

Lee Wisener CeMAP, CeRER, CeFAP, CSME
I am the owner of this site. If there is anything wrong, it's on me! If you want to get in touch, please email me at [email protected]. The site has grown so quickly, I honestly didnt expect the interest or the support, so thank you to everyone who has dropped me a line. More is coming, and I am spending time making it simpler, easier to understand, and also updating it regularly.


Comments (0)
Want to comment on this page? Login or Register.